The Concept Behind Bubble Sort
To remind yourself what the concept behind bubble sort -not especially in Python- is, it might help look into its naming. Think of the analogy like that: you have some random air bubbles below the surface. The larger the bubble is, the higher its buoyancy speed is to rise to the top, and that's it.
The idea behind the algorithm is to compare only two elements simultaneously and iterate over the whole list without going back. In the first step, you look at the first element in the list, in the second step at the second element, and in the last step, you look at the last element. You start at the beginning of the list and compare the first with the second item. If the first item is larger, you switch positions and go on.
Initial list: 	[4, 3, 2, 1]
First step: 	[4, 3, 2, 1] → 4 > 3? True → [3, 4, 2, 1]
In the next step, you would compare the second element (which is now the item that was the first one) with the third item and so on.
Second step: [3, 4, 2, 1] → 4 > 2 ? True → [3, 2, 4, 1]
The Algorithm has done its job if, in one run, no numbers have been switched.
...
Before last step: 	[2, 1, 3, 4] → [1, 2, 3, 4] → 1 change
last step: 		[1, 2, 3, 4]   0 changes → sorted
Implementing the Algorithm
An actual implementation of bubble sort in Python might look like this:
def bubble_sort(unsorted_list: List) -> List:
    number_of_changes = 0
    for index in range(len(unsorted_list) - 1):
        if unsorted_list[index] > unsorted_list[index + 1]:
            unsorted_list[index], unsorted_list[index + 1] = unsorted_list[index + 1], unsorted_list[index]  # swap
            number_of_changes += 1
    if number_of_changes != 0:
        return bubble_sort(unsorted_list)
    return unsorted_list
If you have problems understanding the 5th line
unsorted_list[index], unsorted_list[index + 1] = unsorted_list[index + 1], unsorted_list[index] # swap
That is called an in-place swap. That's possible in Python because the interpreter evaluates expression strictly from left to right. In the case of an assignment, the interpreter will first read the assigning values and then assign them. For example:
a = 5
b = 6
print(a, b)
a, b = b, a
print(a, b)

out1 >> 5, 6
out2 >> 6, 5
So the values a and b effectively swap positions as a gets assigned b and b gets assigned a, after they both have been read. You may read more on this in the Python docs.
Note that I used the concept of recursion (the function calls itself under given circumstances). Using recursion is not necessary here, and if the list is long enough, the system's max recursion depth might terminate your program. You may get to know your systems max recursion depth by using:
import sys
sys.getrecursionlimit()
You might change this constant to 3000 for example:
import sys
sys.setrecursionlimit(3000)
However, I do not recommend doing so. Recursive functions are often way faster than loops, but their memory usage is often immensely. The max recursion limit is set with the reason to prevent infinite loops and extensive memory-usage. Thereby, a non-recursive version might look like this:
def bubble_sort(unsorted_list: List) -> List:
    while True:
      number_of_changes = 0
      for index in range(len(unsorted_list) - 1):
          if unsorted_list[index] > unsorted_list[index + 1]:
              unsorted_list[index], unsorted_list[index + 1] = unsorted_list[index + 1], unsorted_list[index]  # swap
              number_of_changes += 1
      if number_of_changes == 0:
          return unsorted_list
Time Complexity in Big-O-Notation
A common thing in computer science is evaluating algorithms' time complexity for a certain problem to decide which algorithm fits the best. However, it's important to know, that the Big-O Notation only makes statements about the growth in relation to the input-parameter, not the time it takes to compute. This is crucial to understand when optimizing code - as we discuss in our post about when to optimize and when to prioritize readability, premature optimization can often lead to less maintainable code without significant performance gains.
Take these two function for example:
Both functions are considered quadratic in growth in relation to their input, even though the second function will always return a larger value.
Theoretically, there's also a memory complexity to be considered. Still, as most of the time, memory isn't a problem today, computer scientists tend only to give the time complexity of algorithms. The usual procedure is to evaluate the best- and the worst-case scenario of the algorithm concerning a given input of length n.
Given this knowledge, let's try to assume the best possible runtime for this algorithm. The best possible scenario would be the whole list is already sorted, then we would iterate once over the list of length n and return it, as we detected zero changes. The runtime in relation to n would be n-1, as we compare each element with the next until we are at the penultimate element comparing it with the last one.
You might wonder what happens to the operations performed each time the algorithm is called - let's call that factor k - a rule for big-o-notation that then applies is that constant factors are ignored.
Even though we have n calls with k operations, k is a constant factor and is thereby ignored.
The worst-case scenario, in contrast, would be the list totally reverse-sorted. Then would call the algorithm n-1 times as we only shift one element each time we call the algorithm. This would effectively lead to:
n^2-n calls. Another rule for the big-o-notation is that only the term with the largest exponent is relevant. Thereby the worst-case scenario would be described as n^2.
Optimizing Bubble Sort in Python
Suppose you read closely and know about bubble sort, you probably found the implementation in Python not to be optimal. That's because I wanted to keep it simple to understand. In the following section, I want to describe how we can optimize the algorithm drastically with a slight modification. If you don't want to optimize the algorithm or think that math is extraordinarily boring, I urge you to skip this section.
If you think about the algorithm extensively you might notice that in the first iteration over the whole list, the last element will be the largest. In the second iteration over the list, the second-last item will be the second-largest, and so on.
Using this knowledge we can cut the list in length by the last item each time we iterate over the list as it is already sorted. If we formularize this regarding the worst case, we get to the following formula:
In the first iteration, we have n-1 steps, then n-2, and so on, until we have only one element left or no changes. So, for example if we have 8 elements, the worst case will be
28 steps. So the maximum number of steps is exactly the sum of all numbers from 1 to n-1. Something that comes into play now is the Gaussian sum.
Since we only need the sum of numbers from 0 to n-1, we have to modify the formula slightly
This, in turn can be rewritten to
As 1/2 is again a constant factor, the time complexity again would be considered:
This is confusing as the runtime surely will be better. You have to remind yourself that the Big O Notation only makes statements about the growth, not the computation time. The optimized (recursive) code could look like this:
def optimized_bubble_sort(unsorted_list: List) -> List:
    number_of_changes = 0
    for index in range(len(unsorted_list) - 1):
        if unsorted_list[index] > unsorted_list[index + 1]:
            unsorted_list[index], unsorted_list[index + 1] = unsorted_list[index + 1], unsorted_list[index]  # swap
            number_of_changes += 1
    if number_of_changes != 0:
        return bubble_sort(unsorted_list[:-1]) + [unsorted_list[-1]]
    return unsorted_list
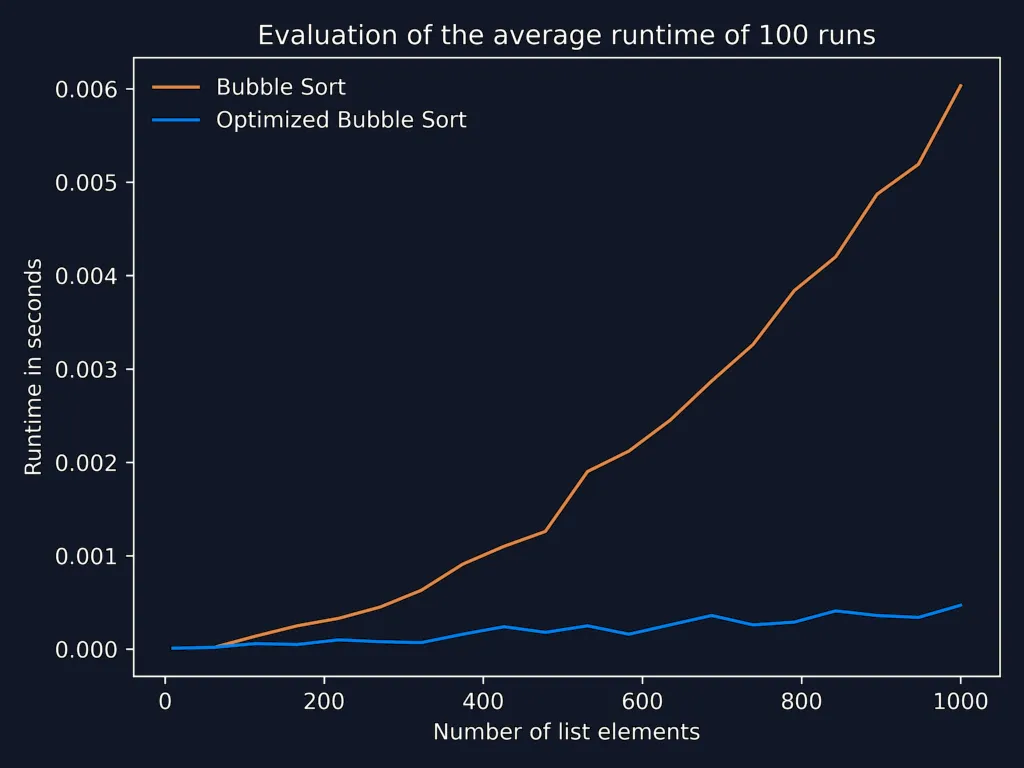
In row 8 you see, that instead of passing the whole list, we pass only the list minus the last element to the function call and append the last element. To prove to you that the optimized version is still considerably faster, I plotted the average runtimes (100 runs) of bubble sort and the optimized version with increasing list sizes from 10 to 1000:
Visualizing Bubble Sort in Python
The following animation (gif) was created using only Python and matplotlib (pyplot):
To reproduce this with any kind of sorting algorithm, you could use a variation of my code:
import os
import pathlib
from typing import List

import imageio
import matplotlib.pyplot as plt
from numpy.random.mtrand import rand
from io import BytesIO

output_path = pathlib.Path(__file__).parent # Directory of execution
frames = list()  # Global list of the frames (file paths)
changes = 0  # Global variable to track the frame number


def bubble_sort(unsorted_list: List) -> List:
    number_of_changes = 0  # Number of changes in the current iteration
    global changes  # Visualization only: Global number of changes → Frame number
    for index in range(len(unsorted_list) - 1):
        if unsorted_list[index] > unsorted_list[index + 1]:
            unsorted_list[index], unsorted_list[index + 1] = unsorted_list[index + 1], unsorted_list[index]  # swap
            visuzalize_step(unsorted_list)  # Visualization only: create a frame and append the path
            number_of_changes += 1
            changes += 1  # Visualization only: increment the global frame number
    if number_of_changes != 0:
        return bubble_sort(unsorted_list)
    create_gif(frames)  # Visualization only: If the list is sorted, create the gif, using the frames
    return unsorted_list


def visuzalize_step(input_list: List):
    global frames  # Ensure the global usage of the variable
    bytes_object = BytesIO()
    plt.figure(facecolor="#111827")  # Background Color
    plt.bar(range(len(input_list)), input_list, facecolor=("#0c4a6e"))  # Create a bar chart using the current values of input_list
    plt.tight_layout()  # Make it use tight layout to reduce borders and margins
    plt.axis('off')  # Remove axis
    plt.savefig(bytes_object)  # Save the plot in-memory
    plt.close("all")  # Ensure everything from pyplot gets closed, to save memory
    frames.append(bytes_object)  # Append the frame path to the frame list


def create_gif(frames: List[BytesIO]):
    animation_path = os.path.join(output_path, "animation.gif")  # Open a new file
    with imageio.get_writer(animation_path, mode='I', duration=1 / 30) as writer:
        # Write images where each is display for 1/30s → 30 frames per second
        for frame in frames:  # Iterate over the frames
            frame = imageio.imread(frame)  # Convert to ndarray
            writer.append_data(frame)  # Write the image to the stream


if __name__ == "__main__":
    unsorted_list = rand(25)  # Create 30 random float numbers in a list
    bubble_sort(unsorted_list)
To briefly describe the code: The idea behind the visualization was to interpret each number in a given list as a bar of a bar chart. All that was left to do was take a picture of the current number order after each change. Then merge all the pictures to create an animated algorithm's illusion. I tried to follow all the clean code principles regarding the animation code, but don't hesitate to comment on anything unclear. Code isn't always as self-explanatory as one might think...